規格
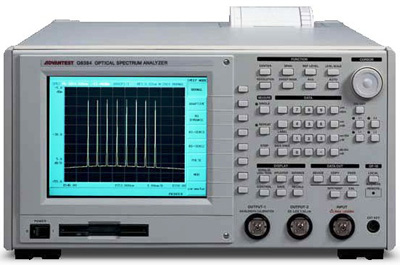
Advantest Q8384 Optical Spectrum Analyzer(OSA)規格
| Wavelength range | 600 ~ 1700 nm |
|---|---|
| Resolution bandwidth(RBW) | 10 pm(state-of-the-art) |
| Wavelength accuracy | ±20 pm(Option 25) |
| Sensitivity | -87 dBm |
| Polarization dependence | ±0.05 dB |
| RBW accuracy | ±2% |
| Measurement functions | Power & Spectral Width、多種功率/光譜寬度量測 |
| DWDM analysis | 支援多種 WDM/DWDM 通道分析功能 |
| Optical amplifier measurements | EDFA/光放大器參數量測 |
| Pulse light measurement | 脈衝光量測 |
| Gated measurement | 支援 gated 量測(loop testing 適用) |
原廠英文說明
Q8384 is a high-grade optical spectrum analyzer (Advantest) with a 4-pass monochromator and extremely low polarization dependance. Thanks to a special method used, a value of ±0.05 dB can be guaranteed, the typical value is as low as 0.02 dB. The narrowest resolution bandwidth and the broad dynamic range make the Q8384 an ideal measuring instrument in the DWDM technology for closest channel spacing. A special measurement function allows the automatic determination of erbium-doped fiber amplifiers (EDFA) parameters; these are e.g. noise figure, gain and spontaneous emission by simple comparison of the signal at the amplifier input with the signal at the amplifier output.All these features are of course also of great advantage for the measurement of laser diodes, LEDs and other light sources, evaluating their parameters by single push button operation. A curve fitting function directly shows the electroluminescence characteristic by fitting a Gaussian distribution into the emission spectrum. This is a valuable aid in the measurement of erbium- doped fiber amplifiers EDFA's and LDs. Special functions for pulsed light allow measurements of fiber loop transmission systems. Internal or external triggering is possible. The measurement time is 0.5 second for a span of 10 nm in fast sweep mode and varies as a function of the span and the required dynamic range. The highest sensitivity is attained for wideband sources with a resolution of 5 nm, while narrowband sources (laser) can reliably be analyzed down to the noise level with narrow resolution bandwidths. A normalization function in conjunction with a white light source enables direct measurement of the transmission and loss characteristics of optical filters and fibers and other components.